Archive
#SP2016 Technical Preview installing as I write this…
Just a quick post to say that I am installing the SP2016 Technical Preview on my personal Hyper-V environment as I write this.
So lets look at the specs I am using.
Host: Windows 8 Pro, Core I7-4770 (3.4GHz Quad core with 8 logical CPU’s), 32GB RAM

NB: I haven’t gotten round to upgrading this PC to Windows 10 yet, but I will when the time is right.
Virtual Machines’s x 3:
- VM001: Active Directory, 2CPU, 1024GB RAM, Windows Server 2012 R2
- VM002: SQL Server 2014, 4CPU, 12288GB RAM, Windows Server 2012 R2
- NB: I initially set it up with 2CPU & 8192GB RAM and it failed during the installation of the binaries just like SP2013 does when you install it with a lack of power
- VM003: SharePoint 2016 TP, 2CPU, 12288GB RAM, Windows Server 2012 R2
All of this, with internal network switching setup and external access for patching etc…
Lastly, given that there is a lot of waiting about, I am watching the Last Ship on my Plex environment whilst I install 🙂

Stay tuned for more details…

Getting started with #ProjectOnline #Portfolio Analysis Part 2 #PS2013 #Office365 #Project #PPM #PMOT
|
I am a Project Server and SharePoint consultant but my main focus currently is around Project Server.
I have been working with Project Server for nearly five years since 2007 for a Microsoft Gold Certified Partner in the UK, I have also been awared with the Microsoft Community Contributor Award 2011. I am also a certified Prince2 Practitioner. This article has been cross posted from pwmather.wordpress.com (original article) |
Following on from my previous post on getting started with the portfolio analysis / strategy functionality where we looked at setting up the drivers and prioritisations we will now look at the analysis part. If you missed the first part, see the link below
In PWA, click the Portfolio Analyses link from the quick launch menu:
Firstly you might want to set up any project dependencies using the Project Dependencies button on the ribbon:
Dependencies are used to include or exclude projects, there are four options:
A “Dependency” is used if you have a situation where one project is selected (primary project) another group of projects are then required. A “Mutual Inclusion” is used if you have a situation where you have a group of projects that all need to be selected if one is selected. A “Mutual Exclusion” is used in the opposite situation to the Mutual Inclusion, if one of the projects is selected then the other projects in the group must not be selected. A “Finish to Start” is used if one project is selected (primary project) then the other projects in the group can’t start until the primary project is finished.
For this post, I have not set up any project dependencies as my data set is very small so we will now create an analysis.
Click the Portfolio Analyses link from the quick launch menu then click the New button on the ribbon and complete the details on the page, this includes a name and description, choosing the prioritisation type, selecting the projects to include and the cost custom field to use for the cost constrain analysis:
As you can see, there is also the option to analyse resource constraints, we will check this check box and more options will appear:
The options here include setting the start and end dates for the planning period to review, the planning granularity (months or quarters), the role custom field – in this example this was updated the “Primary Skill” custom field that was created. There are other settings to filter the resources either by department or RBS, the assignment booking type to use (committed only or committed and proposed assignments) and the project start and finish dates. In this example these were left as default apart from the role custom field.
Next click the Prioritize Projects button in the bottom right corner, this will show the project driver impacts as previously set on the Strategic Impact PDP:
The values can be changed here if needed by clicking in the cell. Click the Review Priorities button in the bottom right corner and the project priorities will be displayed:
Next click the Analyze Cost button in the bottom right corner:
The “Budgeted Cost” field will include the total from all of the projects in the analysis – this is the baseline scenario. If cost wasn’t a constraint we could just leave it there as all projects are selected. What we will do now is reduce the cost limit to $400,000 and recalculate:
Now a project has been moved out of the selection and the strategic value has reduced from 100% to 78%.There are two different charts to view, the default is the Efficient Frontier but there is also a Strategic Alignment chart:
You can also switch from a grid view (default) to a Scatter chart view:
Back on the grid view we can see it moved out the “Migrate Project Server to Project Online” project:
This might be a project we need to run so at that point we can force it in:
Now click the recalculate button on the ribbon to see the impact, it moved out the “New Document Management Solution” project but this also reduced the overall strategic impact to 76%:
This might be the scenario we need so as this point click the Save As button on the ribbon:
You can create multiple scenarios and compare these using the Compare button on the ribbon, this will give you a report like below:
Click close to return to the analysis. You can switch between the scenarios using the Scenario drop down menu:
Now the cost analysis has been done the resource analysis can be reviewed if required, click the Analyze Resources button on the ribbon:
As you can see, analysing the resources has also de-selected another project, the “Migrate Project Server to Project Online” project. This is due to lack of resource availability. At this point you can view the Deficit and Surplus reports:
In the screen shot above you can see that I have negative availability values for the IT Admin role in September and October. Detailed screen shot below:
You can also use the Requirements Details report – this is useful to see where there is a lack of resource availability for the projects, you can see in the resource availability grid the IT Admin role has 0 for September and October and project requirements grid highlights the resource deficit for the de-selected project in red:
You can also highlight the deficit in the resource availability grid using the check box in the top corner:
So now we have two options, we can either change the start date for one of the projects or hire additional resources. Switch back to the Gantt Chart view and in the Metrics sections, add 1 in the hired resources field:
Then press the recalculate button on the ribbon and both projects will be selected:
I will save this scenario as 1 hired resource:
In this example we know we needed an IT Admin for two months but in a large real world portfolio it is likely you would need many resources, the Hired Resource report will detail the type of resources you need, what projects they need to work on and how long you need them for:
Hiring resources is a great option if you are able to do so and when the project deadlines can’t slip.
The other option without hiring resources is to change the start of a project, switch back the the Gantt Chart and change the scenario to the baseline:
We are now back to the original resource analysis where only one project is selected, in the New Start date column for the de-selected project, change the date to July 2015 and recalculate:
Now the project is selected as the IT Admin role has availability then. This scenario can then be saved if required.
The next steps would be to commit the selected portfolio using the Commit button:
This action updates certain fields for the project and can also be used in a project workflow event for moving a project between stages – workflow will be coved in the next mini series of getting started.
Clicking on the quick launch link for the Portfolio Analyses will show all of the scenarios you just saved with links to each:
That is it for the getting started series for the Portfolio Analysis / Strategy functionality – a very quick intro but hopefully enough to get you started if you haven’t used this feature before.

Getting started with #ProjectOnline #Portfolio Analysis Part 1 #PS2013 #Office365 #Project #PPM #PMOT
|
I am a Project Server and SharePoint consultant but my main focus currently is around Project Server.
I have been working with Project Server for nearly five years since 2007 for a Microsoft Gold Certified Partner in the UK, I have also been awared with the Microsoft Community Contributor Award 2011. I am also a certified Prince2 Practitioner. This article has been cross posted from pwmather.wordpress.com (original article) |
Following on from a very popular series of blog posts on “Getting Started with Project Online” I have decided to extend that with another Getting Started series of posts for two areas I didn’t cover in the original getting started series found here: http://bit.ly/1IFInbc
The first mini getting started series will cover the Portfolio Strategy / analysis functionality then we will do the same for Project Workflow.
The Portfolio Strategy feature enables you to align projects with defined business drivers and objectives, the tool can then prioritise the projects based on how they fit with the business driver prioritisation. Further analysis can be done based on cost / resource constraints to work out the projects to run for the best strategic value. A detailed white paper for Project Server 2010 can be found here: Portfolio strategy with Project Server 2010 (white paper). The feature is the same in Project Online. This post will give a quick getting started intro to this feature.
For the purpose of this post I have a vanilla PWA instance with very little data. I have created a new Project Level custom field called “Budgeted Cost” and a new Resource level look up table field called “Primary Skill” – these will be used later. I have also created three very simple projects with values for “Budgeted Cost” and assigned resources to the tasks – these resources also have Primary Skills tagged against them. The projects contain some over allocations to show the resource analysis part. The projects I have are:
Here are the resources:
Now I can get get on with configuring the Portfolio Analysis part. Firstly I will create 5 business drivers. First I need to enable the Strategy links on the quick launch menu, click Edit Links on the left hand quick launch menu:
Check the check box for Strategy and the three links below the Strategy heading:
Click Save & Close from the ribbon menu. Now you should see these links appear on the quick launch menu:
Now we can see the Strategy links we can set up the drivers. To do this click on the Driver Library link and you will see the following:
Click the New button on the ribbon menu and complete the form for the first driver:
Complete each of the fields as required – only the Name is a mandatory field. Once you have created your drivers the Driver Library screen will look like this:
As you can see I have created the following drivers:
- Increase Market Share
- Increase Sales
- Decrease Internal Costs
- Improve Staff Morale
Now the drivers need to be prioritised, click the Drive Prioritization link on the quick launch menu and you will see the page below:
Click the New button on the ribbon and complete the form:
Click the button on the bottom right corner of the page to “Prioritize Drivers” and you will see the page to rate the drivers against each other:
In the example above I clicked the arrow in the “Select a Rating” box and choose how “Decrease Internal Costs” rates against the other drivers like below:
Once the first driver is completed it will look like this:
Click the Next Driver button in the bottom right corner to set the ratings for the next driver. Repeat this process until you get to the final driver then click the Review Priorities button in the bottom right corner. You will then see the driver priority as below:
What is key here is that the rating has been consistent, expand the Consistency Ratio option:
This should be at least 80%, the higher the better. You can create multiple driver prioritisations for different scenarios etc.
The next part is the analysis but before we look at that we will jump back to the Project Center and edit each project to set the impact of each project against the drivers, this is done on the Strategic Impact PDP as seen below for one of the example projects:
This was done for the 3 example projects I have created.
Now that is set up the next part is to create an analysis but that will be covered in Part 2 that will follow.
A Developer’s First Estimate Using Microsoft Project
At some point you will be asked to create an estimate for a new project, feature or bug fix. I use Excel for creating simple project estimates. Excel serves well for this purpose. I already know how to use Excel, it’s simple, and virtually anyone can view the resultant *.xlsx file. My Excel estimates usually look something like this:

What’s not to like about this estimate? It’s nicely formatted. I highlighted the bottom line, which is the only line pointed-haired bosses likely look at. The truth is that this estimate is just fine for simple cases like minor bug fixes and one-off, small projects. As a front-line developer, all my estimates were created quickly in Excel just l like the example above.
Now that I am a technical lead, the projects I am asked to estimate are larger, more complex, and involve tasks that may themselves consist of sub tasks. When an estimate expands to anything more complicated than a simple single-level list of tasks and hours then you need to consider using a serious estimating and scheduling tool like Microsoft Project.
In this blog post I provide a couple of tips that I have found useful for jumping into Project and using it much like I used Excel for “simple” project estimation. Again, these steps work for me. I hope you find them useful too.
Open Microsoft Project and Start with a Blank Project
You don’t need a PMP or PRINCE2 certification to use Microsoft Project. Before we get started, take a deep breath and relax. It’s not as bad as you think!
I start with a new Blank Project template. Project ships with a Software Development Plan template which may be very useful, but that is beyond the scope of this discussion.

Add the Work (hours) Column
Our Excel estimate consisted of a Task column and a column I used to sum up work hours. We see a task column but the Blank Project template does not include a work column. In order to make Project resemble my Excel estimates I want to add the work column.
Right click on the Duration column and select Insert Column.

You can filter the extensive list of columns by typing “Work” in the column header.

Now your screen should begin to look familiar. You will have a Task and adjacent Work Column.
The next thing I like to do is name my project on the first line. This is critical to getting your work hours to roll up. On the first line click into the Task Name column and type the name of your project. In this example I used “My Software Project”. Don’t worry about providing a value for the hours column on this line. Project will do this for us.

Next begin adding the individual tasks that comprise the project along with an hours estimate of each task. Your estimate should resemble the image below.

Grouping Tasks
Now, let’s do something very cool! Let’s highlight each of the tasks below the first line “My Software Project”. Once these lines are highlighted click the indent button in the tool bar.

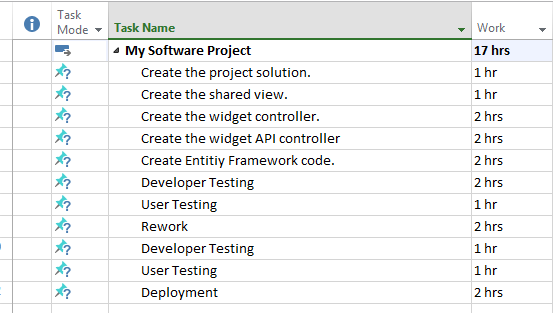
Now you can see that the sum of the hours for all tasks have rolled up into the top level “My Software Project” task. Pretty cool eh?
More Task Grouping
You can’t have too much of a good thing. Just as it is really helpful to see the total hours of our project we can take that a step farther by rolling our tasks into subdivisions.
Our estimate contains two distinct types of activities. Those where we are actually building the solution and those where we are testing and reworking our solution. Using the same steps we performed above we can further group related tasks by indenting. However, we first we need to add a couple rows to represent rollup lines. We are going to add Development and Testing tasks.
Tip: you can easily add tasks by clicking into the row where you want the new task added and pressing the insert key. The task will be inserted on the current line and existing tasks will be moved down to accommodate the new row.
Next we are going to highlight the tasks that fall below Development and above Testing and click the indent button. Repeat these steps for the tasks that fall below Testing but before Deployment. Your estimate should look like this:

Notice how all the “development” tasks are rolled up to the development line and all the “testing” tasks are rolled up to the Testing line. Also note that the overall project My Software Project rolls up the total hours for the entire project!
Nesting your tasks allows you to easily analyze your estimate and know where the hours are going. In this case, we can see that roughly half of the project time is spent actually writing code whereas the other half is dedicated to testing an rework. I can almost smell the cardstock on my PMP certification!
Predecessors and Scheduling
We could just leave well enough alone. As it stands, we created a perfectly good, simple estimate using Microsoft Project. However, I feel that I would be remiss if I didn’t mention predecessors and scheduling.
You know as well as I do that once your boss drinks in the beauty that is your estimate the next words that are spoken will be “Looks great! When can we have this in production?” Let’s address that question.
To complete our simple estimate we are going to spend just a few moments on simple scheduling! This means filling the predecessors column for our tasks and setting the task mode.
Setting the Task Mode to Auto Schedule
Once you have a good understanding of the task details of a project, you can switch the task’s mode to Auto Schedule. To do this, click into the Task Mode column and select Auto Scheduled from the drop down list. Repeat this selection for every task in the project. Setting the task to auto schedule allows project to create a project schedule based on the amount of work, predecessor tasks, the number resources assigned to the task, and other factors such as weekends and work holidays.

Setting Task Processors
Setting a task’s predecessor helps Project create a schedule by defining which prerequisite tasks must be completed before a subsequent task can begin. For instance setting Task B’s predecessor to Task A constrains Task B’s start date to the completion (end) date of Task A. To do this we use the predecessor column in project.

Notice that the predecessor column in task four (4) is set to task three (3). This means that task four (4) cannot begin until task three (3) is complete. I filled in predecessor values for all the tasks in the project.
Tip: Don’t set the predecessor value for a column that used for rolling up sub-tasks. For instance I left the predecessor of the Development and Testing columns blank. Instead, set the predecessor of the first task in the group to the last task in the preceding group.
Assuming you have set all your predecessor tasks correctly and your tasks are set to auto schedule you should begin to see the Gantt Chart fill itself out with your estimated project schedule.

This is Just the Beginning
The purpose of this blog was just to get you started using Project for estimates. The goals is that you could hand the estimate over to a PM that would transform your estimate into a fully realized project plan.
There are many other concepts that apply to scheduling such as resources and concurrent tasks. Perhaps these are a topic for a subsequent post.

![]()
   I am a senior software developer and development team lead in Houston Texas. I am passionate about the “art” of software development. I am particularly interested in software design patterns and the principles of SOLID object-oriented code. I am an evangelist for test driven development. I love to think and write about my day-to-day experiences in the trenches of enterprise IT. I relish the opportunity to share my experiences with others. From the wire to the presentation, I am holistic solutions guy. I have broad experience in client side technologies such as Javascript, Ajax, AngularJS, Knockout, and Bootstrap. I have extensive experience with MVC, MVVM, and ASP.NET Web Forms. I am strong in SQL Databases, performance tuning, and optimization. I also have a background in network engineering, wide-area and inter-networking. This article has been cross posted from jcclements.wordpress.com/ (original article) |

August Nintex Workflow updates are very exciting.
So nice to be on Office 365 and not having a weekend downtime to upgrade a third party tool.
(read my comments on each item below)
We’ve made some changes since last time…
Workflow Gallery
- Complete the work faster and with fewer clicks. When opening Nintex for Office 365, you’ll now see an entry page instead of the design canvas. From this entry page, you can create new workflows, modify existing workflows and delete unwanted workflows. Depending where you are in a workflow design when you open Nintex, it will display the relevant actions for that context first and then a secondary set for other workflows. Read more…
[FS] Opening an existing workflow was a bit puzzling vs. on premises Nintex because it would always open blank until we open it manually as if opening a previous version. Now it doesn’t feel like we have lost them, they are visible.
Task Escalation
- We’ve now introduced the option of escalating a task to someone else or completing a task after a set period of time. Find this capability within the Assign a Task and Start a Task Process actions. Read more…
[FS] This is excellent. We already had it on premises for a long time, now on Office 365.
This means that we can build something like: if a task is still awaiting a Manager who has not completed it within 5 days then Nintex Workflow will escalate automatically to another person to approve such as the manager of that last task assignee. Real business value !
via François on SharePoint & more http://bit.ly/1Jmw98e
|
French native Sharepoint Consultant living in London. A crossway between a designer, developer and system architect. Prefers stretching the limit of out-of-the-box features rather than breaking them into code. When not working with Microsoft Sharepoint François is often found on Web2.0 News sites and related social networking tools.
This article has been cross posted from sharepointfrancois.wordpress.com/ (original article) |
#ProjectServer and #SharePoint 2010 / 2013 August 2015 Cumulative Update #PS2010 #SP2010 #PS2013 #SP2013 #MSProject
|
I am a Project Server and SharePoint consultant but my main focus currently is around Project Server.
I have been working with Project Server for nearly five years since 2007 for a Microsoft Gold Certified Partner in the UK, I have also been awared with the Microsoft Community Contributor Award 2011. I am also a certified Prince2 Practitioner. This article has been cross posted from pwmather.wordpress.com (original article) |
The Office 2013 August 2015 Cumulative Updates are now available, please see the links below:
Project Server 2013 August 2015 Server Roll up package:
http://bit.ly/1J2o2Sp
Project Server 2013 August 2015 CU:
http://bit.ly/1J2o50p
Project 2013 August 2015 CU:
http://bit.ly/1L3qmrT
Also worth noting, if you haven’t done so already, install Service Pack 1 http://bit.ly/1uorn2C first if installing the August 2015 CU.
The Office 2010 August 2015 Cumulative Updates are now available, please see the links below:
Project Server 2010 August 2015 Server Roll up package:
http://bit.ly/1L3qpDZ
Project Server 2010 August 2015 CU:
http://bit.ly/1J2o50r
Project 2010 August 2015 CU:
http://bit.ly/1L3qmrV
SP2 is a pre-requisite for the Office 2010 August 2015 CUs.
As always, fully test these updates on a replica test environment before deploying to production.
#ProjectOnline reporting using #PowerBI Part2 #BI #Office365 #Reports #PPM #PMOT
|
I am a Project Server and SharePoint consultant but my main focus currently is around Project Server.
I have been working with Project Server for nearly five years since 2007 for a Microsoft Gold Certified Partner in the UK, I have also been awared with the Microsoft Community Contributor Award 2011. I am also a certified Prince2 Practitioner. This article has been cross posted from pwmather.wordpress.com (original article) |
This is the second post for the Project Online reporting with Power BI intro I created earlier this week. If you missed it, a link to the post can be found below:
In this post we will look at creating new reports using the Power BI Desktop tool then adding these to Power BI.
Firstly if you haven’t already, download the Power BI Desktop: http://bit.ly/1giTosP.
Once launched you will see a getting started type page:
Close this and you will see a blank canvas:
The first thing we need to do is get the data, to do this click the Get Data button on the ribbon then OData feed:
In the next window, paste in your Project Online OData feed, in this example I am using:
Click OK and you will see your data:
At this point you can click OK to load the data but I would Edit the data to only select the fields you want. So in this example I will click the Edit button to load the query editor. The Query editor is very similar to the Power Query editor you see in Excel:
I only want certain columns so I will select the columns I want then remove the others. To select the columns just click the first one and hold down the Ctrl key then click the rest:
Or use the Choose Columns button on the ribbon:
Once all selected, click the Remove Columns > Remove Other Columns:
Notice in the Query Settings pane you see the Applied Steps, so you can easily undo a step if required:
That is the project data loaded, now I want to load the task data. In the Query Editor click New Source > OData feed:
Paste in the URL for the Tasks feed:
Click OK to add the new source. I then selected the columns I wanted and named the query:
There is also an advanced editor that I used to filter out the summary tasks by modifying the URL:
The advanced editor can be used to type the code to manipulate the data but use the UI where possible.
Now we have two individual datasets / queries, we need to merge the queries to create the join, click the Merge Queries button:
Chose the columns and table to join then the join type:
Click OK.
Once you are happy with the data click Close & Load > Close & Load:
This will load the dataset to the report, see the fields pane:
Then add your visualisations on, the first one I added is the Treemap:
Then drag the fields to the visualisation settings on the pane, in this example I use Project Name for the group property and % complete in the values property:
Add the other visualisations you need, the example I created looks like this:
I then added another page to visualise some task information:
A very basic report but that gives you the idea how easy it is to create visualisations of your Project Online data using the Power BI Desktop.
The next stage is to add this to Power BI. To do this I can either publish the report using the Publish button or from the Power BI site, upload the file. For this example I clicked the Publish button:
The report will then be available in Power BI. The manual way from the Power BI portal site is to click the Get Data button:
Then chose the type of data, for this example I will use Files:
Then click local file:
Locate the Power BI file (or can be Excel etc. but this was a Power BI file) and add the file:
Once loaded, Power BI will create the dataset, the report and create a dashboard with a link to the report (note, I removed everything from my Power BI portal so that is was clean for the screen shots :))
Clicking the link under the Reports heading will load my report:
Clicking on an element from a visualisation will filter the data in the other visualisations:
The first thing to do is set up the dataset to refresh, to do this click the ellipsis next to the dataset then click Schedule Refresh button on the fly out menu:
Expand Manage Data Sources:
Enter the credentials for both sources, click the Edit Credentials link, select the oAuth2 for the Authentication Method and click Sign in:
Enter the credentials for the Project Online tenant and click sign in. Repeat for the other data source.
Now expand the Schedule Refresh section and turn on the “Keep your data up-to-date”:
Click Apply. The data sources will update Daily now but you can also update it on demand using the Refresh Now option:
When the data is refreshing you will see a spinning icon next to the dataset:
Now lets look at the dashboard. I will create a new Dashboard called “Dashboard Example” using the + button next to the Dashboards heading:
Once created you will see a blank canvas:
Now I can pin visualisations to this dashboard. To start with access the report previous loaded, hover over a visualisation and click the pin icon:
Navigate back to the dashboard and you will see the visualisation:
Repeat this process until you have the dashboard you need, for example:
You can also create new visualisations from the dashboard using the natural language query “Ask a question…” field, start typing a question about the data, for example “show project work” will create a visualisation for the total project work in the dashboard:
This visualisation can then be pined using the pin too. You can also change the default visualisation for the data returned using the visualisation pane, see the example below for a different query:
Once finished, the visualisations can be been seen on the dashboard:
The properties of the tiles can be edited using the pencil icon:
This loads the Tile detail pane:
Clicking on a visualisation that was added from a report will navigate you to that report directly.
You can then share your dashboard out to other people in your organisation using the Share Dashboard option, this loads the following window:
Enter the email addresses and click Share.
This is just touching the surface of what you can do with Power BI, take a look today – it will be your favourite reporting tool!
#ProjectOnline reporting using PowerBI Part1 #BI #Office365 #Reports #PPM #PMOT
|
I am a Project Server and SharePoint consultant but my main focus currently is around Project Server.
I have been working with Project Server for nearly five years since 2007 for a Microsoft Gold Certified Partner in the UK, I have also been awared with the Microsoft Community Contributor Award 2011. I am also a certified Prince2 Practitioner. This article has been cross posted from pwmather.wordpress.com (original article) |
Since Power BI 2.0 was released a week or so ago I thought it was time I created a blog post on Power BI and show off some of the cool functionality Power BI has to offer. In this first blog post we will take a look around Power BI and see what it has to offer and include some useful links to help you get started.
So firstly, what is Power BI? In short Power BI is a cloud reporting tool that enables you to create great visualisations for your data. I won’t go into details here as there is plenty of information available – a good place to start is here: http://bit.ly/1M9xXbf
On my Power BI instance I have created some example reports and a report dashboard already as you can see below:
Displayed above is my example Report Dashboard displaying various visualisations for % complete, Work and Cost.
The first thing you need to do before you can create the dashboards is get the data available in Power BI. You can do this by clicking the Get Data button. This will load the screen below:
In my example I selected the Files option and loaded up a file that contained my data. This could be an Excel file, CSV file, Power BI Desktop file etc. As I wanted to see my Project Online data here I chose a file I had already created earlier using Power BI Desktop that displayed my Project Online data – more on Power BI Desktop in a later post when we look at creating a new report and dashboard.
Once the report file is added you will see it appear under the Datasets heading on the left navigation pane and under the Reports heading:
Clicking on the link under the dataset enables you to create new report:
Clicking the ellipsis allows you to refresh the data or schedule a refresh. This functionality will depend on the data source you use in the file – for Project Online OData, both of these work:
Firstly you will need to click the schedule refresh option, expand Manage Data Sources:
Click Edit Credentials then chose oAuth2 and click sign in then enter the credentials for a user that had access to the OData API.
Clicking on the link under the Reports heading displays the report file I uploaded as a data source (created in Power BI Desktop but could be Excel etc.):
From the report you can add visualisations to the dashboard using the “Pin Visual” pin option. This becomes visible when you hover over a visualisation on the report:
You can create many different data sources, reports and dashboards. From the dashboard you can click a visualisation and it will drill down to the report itself. In this example if I click on my % complete treemap visualisation on the dashboard it will load the source report:
Clicking the treemap:
Loads the source report:
From the dashboard I can also create new visualisations and pin those, to do this I can use the natural language search – use the “Ask a question about the data on the dashboard” field:
For example, I might want to see a count of projects for each project owner, so I start typing “count of projectname by ProjectOwnerName”:
You can see Power BI already started to get the data and create a visualisation that matched the data type. Once I had finished typing my query it gave me this:
You can then change the visualisation using the options on the right hand pane, in this example I switched it to a multi row card:
I can then use the pin to pin the visualisation to my dashboard:
Clicking the pin will give you a notification and add the visualisation to the dashboard:
Now if I look at my dashboard I can see it has added the new visualisation at the bottom:
Next up I will walkthrough creating a new report using Power BI Desktop and load that to Power BI.
In the meantime here are some useful links for Power BI:
Power BI site: http://bit.ly/1P4vk8X
Power BI overview: http://bit.ly/1M9xXrP
Support: http://bit.ly/1P4vk8Y
Power BI blog: http://bit.ly/1M9xXrT
Windows 10 upgrade adventures–HP Stream 7 edition #Win10 #Upgrade #HPStream7
So Windows 10 is out (RTM’d if we are allowed to use that term anymore) and as ever I like to upgrade my machines and live and breathe the new software… it is the best way to get used to the way things are going to be from now on…
I had dabbled with the insider preview but honestly time didn’t allow me to go into all the features properly.
As part of a whim late last year, I bought myself an HP Stream 7 for $79. As a Windows 8.1 machine, it was ok, but the screen was too small to be massively useful. For things like Netflix, Hulu, Plex etc… it was perfect however.

So what better machine to experiment with an upgrade…
Of course this wasn’t going to be easy… with only 32gb of storage and a low spec processor, it may not even work at all! However, with an update, I got the magic icon to reserve my copy, so why the heck not!
Attempt 1 – Command Line
So June 29th came and went and apparently it wasn’t my turn. After some discussions with my colleague Jin at work, he pointed me to this command line tool to force the upgrade:
- wuauclt.exe /upgradenow
So I did exactly that and everything seemed great. Downloading files, checking system specs, then… failed!
It would appear that the 15gb of space I had on the device was not enough!
So I cleared a bunch of space (uninstalled Office 365, cleared down my OneDrive files etc…) and tried again. Same process…
Alas I had the same problem…
Attempt 2 – Reset the device
So I go into work the next day and Jin is there with his HP Stream 7 and a fancy new Windows 10 installation.
How? What? Huh?
It would appear that resetting the device back to factory defaults gave enough space to do the upgrade for him.
So I tried exactly that, but unlike him, I got a different experience…
I decided not to connect a Microsoft Account incase that used up more space with sync’s from other machines…
Ran the update process and all it did was update to the latest Windows 8.1 patches.
At this point, I had no space to install Windows 10 again.
Attempt 3 – Reset the device (Microsoft Account edition)
So I reset the device again, thinking I would just download the tool to run the upgrade instead.
This time, I use my Microsoft Account to login to my device and sudden voila! There is a new OS to install – wanna do it? Yeah I do!

It downloaded the files, ran the checks and started the process. It took approximately 2.5 hours but I am there, it works and initial impressions are awesome!
I will probably report back further on my progress but for now, I am going to enjoy my new HP Stream 7 Tablet Mode experience!

Different approach to #Project team collaboration, what about #Office365 Groups? #ProjectOnline #PPM #PMO
|
I am a Project Server and SharePoint consultant but my main focus currently is around Project Server.
I have been working with Project Server for nearly five years since 2007 for a Microsoft Gold Certified Partner in the UK, I have also been awared with the Microsoft Community Contributor Award 2011. I am also a certified Prince2 Practitioner. This article has been cross posted from pwmather.wordpress.com (original article) |
Inspired by my colleague Alan Eardley’s recent webinar on Office 365 groups, I thought it might be good to blog about this from a project perspective.
For many types of projects, team collaboration is very important. There are many different options currently to support team collaboration. The default one being the project site in a Microsoft PPM environment. Other options include email distribution groups, shared mailboxes, Yammer etc. The latest option to consider is Office 365 groups, this feature was released towards the end of last year in Office 365. A good intro video on Office 365 groups can be found here: http://www.youtube.com/watch?v=t3OLvYXepvE
Groups are managed via the Outlook Web App on your Office 365 tenant, you will see the Groups section below the folders in the left pane:
Clicking the blue + symbol next to the Groups heading or the “Create group” link will load a pane of the right hand side:
Give the group and a description. The Group ID will be generated automatically from the name you enter but can be modified if required.
Then choose the privacy level, typically you would probably only want the project team members or a subset of the project team to have access so in this example it will be set to Private.
I have also enabled the subscribe option so that members receive group conversations and calendar events in their inboxes.
Then click the Create button at the top of the pane and the group will be created:
Next I need to add the members to the group:
For this example I have only added a generic CPS user account, once all the users have been selected click the Add button at the top of the pane and you will see an adding members message:
Your group is then created:
The group name, description and image can easily be edited by clicking the edit icon on the group image or the edit group option on the ellipsis menu.
You can also let people outside of the organisation email the group too – these appear as normal conversations in the group. Once the changes are made click save. In this example I clicked discard then you can view the group / updates to the group.
From here members can easily start new conversations:
Easily reply or like a message:
Members can navigate to the group calendar, notebook or file share:
Easily create meetings in the group calendar and invite the group members:
Each group has a dedicated OneDrive site to share documents:
Keep in mind that if the group is deleted the documents will be lost so key documents probably want to be stored in the project site / document management portal.
You can then add a link on the Project Site to the Office 365 group if needed:
Take a look and see what you think.


You must be logged in to post a comment.